Many people are convinced that the bigger the biceps, the healthier the human. Who wouldn’t want to look like a superhero? But it’s muscle quality and strength that are often overlooked. Often more important than size itself. And too much muscle may be a negative thing. Why is muscle vital for overall health? How does its quality decline with age? And what’s the optimal amount for lifelong health? Well, let’s get into it!
Muscle Mass
Muscle is more than an attractive aesthetic. It makes everyday living better [1]. It’s easier for me to shovel the driveway, mow the lawn, garden, and carry groceries than it is for my grandma. And adequate strength allows me to maintain a strong posture throughout. This prevents injuries and reduces stress on the joints. Thus, increasing the longevity of my higher quality of life. But does physical improvement lead to mental improvement?
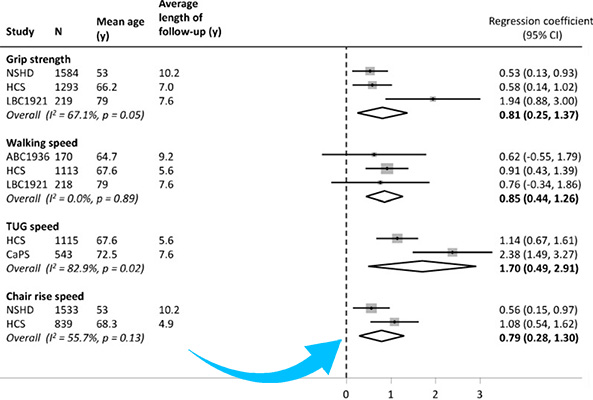
Many studies have run participants of all ages through basic fitness assessments. They test grip strength, walking speed, and chair rise speed. Participants then complete a mental wellness assessment before and after an extended exercise program. And what they find is improved physical health leads to improved mental health [2]. More muscle and strength lead to more mental clarity and optimism. Look better, feel better.
But muscle does more than just that. Muscle is the most abundant insulin-sensitive tissue in the body [3]. If you’re insulin resistant, your body works overtime to produce more insulin to maintain life. This can lead to diabetes, obesity, and metabolic syndrome. Instead, building muscle can increase utilization of existing insulin. Your body can relax on the overtime and resist the consequent diseases. This is just one positive adaptation of many that occurs with increased muscle mass. These positive adaptations lead to longer, healthier lives. But are all muscles the same and what’s most important?
Types of Muscle and Age-Related Decline
Type 1 muscle fibers are commonly called slow twitch fibers. They produce less force but have increased endurance. Aerobic activities like walking, running, and biking utilize more of these type 1 fibers. Type 2 are the opposite. These fast twitch fibers produce more force but tire quickly. Anaerobic activities like stopping a fall, weightlifting, and sprinting utilize more of these type 2 fibers. Each has advantages in everyday life so maintaining both is critical. But these type 2, fast twitch fibers, decline more rapidly with age [4].
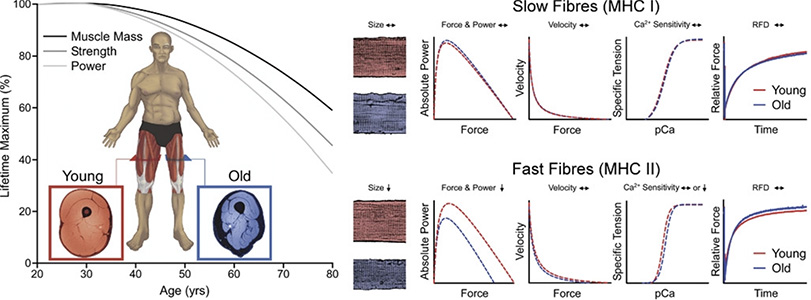
Muscle mass in general starts to decline in the 4th and 5th decade of life. This is largely preventable with resistance training. But if not prevented, .5-1% of muscle mass is lost per year [4]. This progressive loss of muscle is the first stage of sarcopenia [5]. Surprisingly, muscle strength is lost at a faster rate of 1-3% per year [4]. Loss of muscular strength is the second stage of sarcopenia [5]. Finally, muscle power is lost at the fastest rate of 3-5% per year [4]. This decline in physical performance is the third stage of severe sarcopenia [5]. This suggests muscle strength and power are equally if not more critical than mass itself. But how can we measure muscle mass and what’s the optimal range?
Measuring with DEXA Scans
As I’ve mentioned previously, DEXA scans are the gold-standard in measuring body composition. They break up the body into three components: fat, bone, and fat-free mass. Fat-free mass is mostly muscle but includes organs, connective tissues, and blood too. If we just use fat-free mass to gauge muscle mass, then there’s some interference that’ll reduce measurement accuracy. Luckily, DEXA scans can measure fat, bone, and fat-free mass specifically on the arms and legs. This decreases interference from numerous organs. This measurement is called Relative Skeletal Muscle Index (RSMI) and is used to gauge sarcopenia risk.
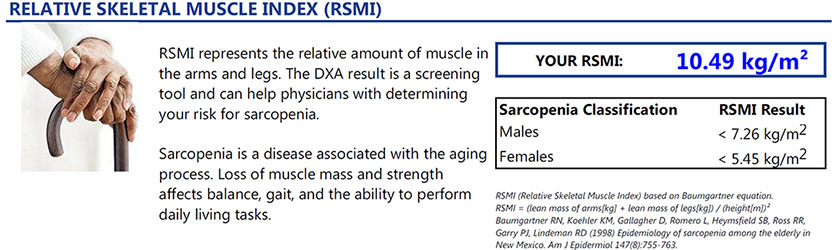
My scan in November assessed my RSMI at 10.49 kg/m2. That’s well above the sarcopenia classification of 7.26 kg/m2 for men and 5.45 kg/m2 for woman. If I maintain my resistance training, I shouldn’t have any worries about nearing that level. Ideally, a level above 8.7 kg/m2 and 7 kg/m2 should be maintained for men and women, respectively. But not everyone has access to a DEXA machine.
Measuring with Body Fat Percentage
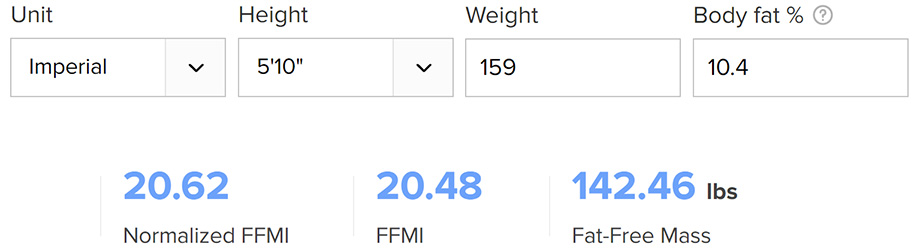
Luckily, you can calculate your Fat-Free Mass Index (FFMI) quite easily. All you need to know is your height, weight, and body fat percentage. See my article on body fat for various measurement methods (What is the Optimal Body Fat Percentage?). Then just plug those numbers into any online calculator. Below, you can see my normalized FFMI of 20.62. The normalized FFMI scales better for various heights. Ideally, men should aim for a normalized FFMI above 19 and women above 16.5. This amount of muscle mass maintained over your lifespan will lead to measurable improvements in how you look, feel, and function.
But can you have too much muscle? A male FFMI above 25 or a woman above 22 is suggestive of steroid use when body fat is low. It’s not easy to get to these levels naturally or without being overweight [6]. Even levels above 22 for a male or 19 for a female may be too much. This amount of muscle mass will either push you into higher, less desirable BMI categories or drop your body fat percentage too low. Even bodybuilders or powerlifters who weigh a lot with low body fat percentages worry me. Carrying around muscle tissue increases demands on the cardiovascular system. It also puts more stress on your digestive system with the increased caloric intake. And while maintaining substantial amounts of muscle may look cool to some, I’m not sure it’s optimal for long-term health.
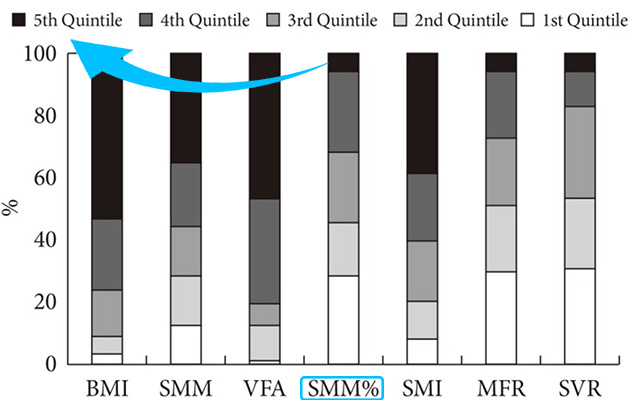
Studies have also shown that the ratio of muscle mass to body composition, rather than total muscle mass, is a strong predictor of metabolic syndrome and early mortality [7]. Therefore, I think it’s best to get into the 19-22 normalized FFMI as a male, or 16.5 to 19 as a female (assuming you have an optimal BMI). And once you’re in those ranges, focus on increasing muscle quality. Speed, strength, and power are critical aspects to train as you age. These will provide benefits well beyond muscle mass alone.
Final Thoughts
Muscles are the most abundant insulin-sensitive tissue in the body. They prevent disease, death, and disability. But they also increase the experience of life! Everyday living is easier and mental health is boosted. Achieving a normalized FFMI between 19 and 22, or 16.5 and 19 is best for men and woman. But it’s muscle speed, power, and strength that decline the quickest with age. So, if you’re interested in protocols to optimize these factors, subscribe to my weekly newsletter. You’ll get updated immediately when I post on these topics for health excellence.

Hi, I’m Brandon Zerbe
Welcome to myHealthSciences! Every week I share habits for health excellence. I do this by covering topics like Fitness, Nutrition, Sleep, Cognition, Finance and Minimalism. You can learn more about me here.